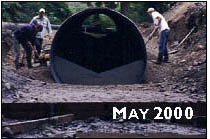
The Scorecard essentially is the state's business plan for salmon recovery. It's a performance management system for tracking data, measuring progress and changing course where needed. The first draft was released in November 1999. After months of outreach with state agency task teams and many local government partners, the May 2000 scorecard was released.


S t a t e  o f  W a s h i n g t o n

Salmon Recovery
Scorecard


Photo Attributions:
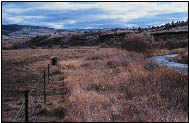
Eastern Washington Riparian: David Mudd
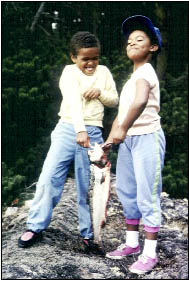
Children Fishing: Hal Beecher
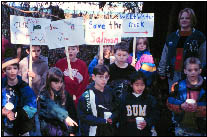
Belfair Elementary 3rd Graders - Annual Salmon Release: Bob Patterson
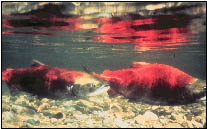
Culvert: Chris Detrick


Salmon Recovery Scorecard

Goal: Restore salmon, steelhead, and trout populations to healthy and harvestable levels and improve habitats on which fish rely.
To protect an important element of Washington's quality of life. . .
  • We will have productive and diverse wild salmon populations.
  • We will meet the requirements of the Endangered Species Act/Clean Water Act.
  • Our habitat, harvest, hatchery, and hydropower activities will benefit wild salmon.
  • Freshwater and estuarine habitats are healthy and accessible.
  • Rivers and streams have flows to support salmon.
  • Water is clean and cool enough for salmon.
  • Hatchery practices meet wild salmon recovery needs.
  • Harvest management actions protect wild salmon.
  • Enhance compliance with resource protection laws.
  • We are engaged with citizens and our salmon recovery partners.
  • We will reach out to citizens.
  • Salmon recovery roles are defined and partnerships strengthened.
  • Our building blocks for success include...
  • Achieve cost-effective recovery and efficient use of government resources.
  • Use the best available science and integrate monitoring and research with planning and implementation.
  • Citizens, salmon recovery partners and state employees have timely access to the information, technical assistance, and funding they need to be successful.
  • More details on measurements in the scorecard...

    To protect an important element of Washington's quality of life. . .

    A. We will have productive and diverse wild salmon populations.

    1. Percentage of wild stocks classified as healthy.
    2. Percentage of monitored watersheds/WRIAs where juvenile salmon production and productivity targets are being met.
    3. Percentage of listed wild stocks meeting spawner objectives.

    B. We will meet the requirements of the Endangered Species Act/Clean Water Act.

    1. Percentage of key state programs consistent with ESA and CWA requirements.
    2. Number of recovery plans submitted to NMFS/USFWS; number approved by NMFS/USFWS.
    3. Impact on Washington and regional economies after Salmon Strategy has been in effect.

    Our habitat, harvest, hatchery, and hydropower activities will benefit wild salmon.

    C. Freshwater and estuarine habitats are healthy and accessible.

    1. Miles of accessible, fish-bearing streams with high, medium, low and unknown quality riparian and floodplain conditions.
    2. Miles of streams opened by correcting passage barriers and screen obstructions.
    3. Percentage of hydro projects (dams and water impoundments) operating in a way that is a totally/mostly/partially/not "fish friendly" manner.
    4. Percentage of marine and estuarine habitats with high, medium, low, and unknown quality.

    D. Rivers and streams have flows to support salmon.

    1. Volume of water restored to salmon streams where water availability is a limiting factor.
    2. Phase-in indicator: Percentage of salmon streams with flows that, over time, closely mimic natural conditions. (WQI)

    E. Water is clean and cool enough for salmon.

    1. Percentage of monitored salmonid-listed waters with polluted water for which clean water plans have been developed.
    2. Phase-in indicator: Percentage of WRIAs with acceptable WQI readings.

    F. Hatchery practices meet wild salmon recovery needs.

    1. Percentage of hatchery facilities and programs operating in a way that is consistent with wild salmon recovery.

    G. Harvest management actions protect wild salmon.

    1. Percentage of wild stocks where harvest protection goals have been met.

    H. Enhance compliance with resource protection laws.

    1. Average compliance rate for fishers by key fishery.
    2. Compliance rate for each key habitat protection regulation.
    3. Percentage of local governments that have adopted ESA-consistent shoreline master programs.

    We are engaged with citizens and our salmon recovery partners.

    I. We will reach out to citizens.

    1. Number of JNRC agency communications and outreach efforts supporting salmon recovery objectives.
    2. Percentage of improvement in citizen awareness measured through "salmon self-assessment."
    3. Number of people involved in volunteer watershed stewardship, salmon protection or restoration activities.

    J. Salmon recovery roles are defined and partnerships strengthened.

    1. Number of ESUs where agreement exists among governments regarding how salmon recovery decisions will be made.

    Our building blocks for success include...

    K. Achieve cost-effective recovery and efficient use of government resources.

    1. Number of state salmon recovery regions with a coordinated and science-based process for identifying and evaluating, and then setting priorities for salmon recovery projects within those regions.
    2. Percentage of salmon recovery funds spent on: restoration, preservation, assessments, separate monitoring and evaluation, separate planning, and administration.
    3. Percentage of grant applicants who strongly agree that the funding process is helpful, fair, simple, effective, and informative.

    L. Use the best available science and integrate monitoring and research with planning and implementation.

    1. Percentage of projects funded that are identified in science-based assessments meeting baseline criteria.
    2. Number of key guidelines for projects and activities affecting habitat submitted to NMFS/USFWS; number approved by NMFS/USFWS.
    3. Number of ESUs with recovery goals established.
    4. Number of WRIAs with baseline assessments completed.
    5. Number of peer-reviewed applied research and monitoring efforts addressing critical salmon recovery issues.

    M. Citizens, salmon recovery partners, and state employees have timely access to the information, technical assistance, and funding they need to be successful.

    1. Percentage of data systems and data sets supporting salmon recovery that meet requirements for integration, accessibility, usability, importance, degree of analysis/technical ability required for use, geographic coverage, and geographic data accuracy.
    2. Percentage of priority projects where authorized federal funding subject to ESA consultation is spent in a timely manner.
    3. Number of key protocols developed and communicated for collection, assessment, and evaluation; number approved by NMFS/USFWS.
    4. Amount of funding and technical assistance provided to salmon recovery partners.
    5. Percentage of salmon recovery partners that are highly satisfied with coordination, cooperation, and services provided by state agencies.

    Note: For purposes of the scorecard, the term "salmon" will be used to refer to all species of salmon, steelhead, trout, and char native to Washington State.

    Back to Home